Our Approach
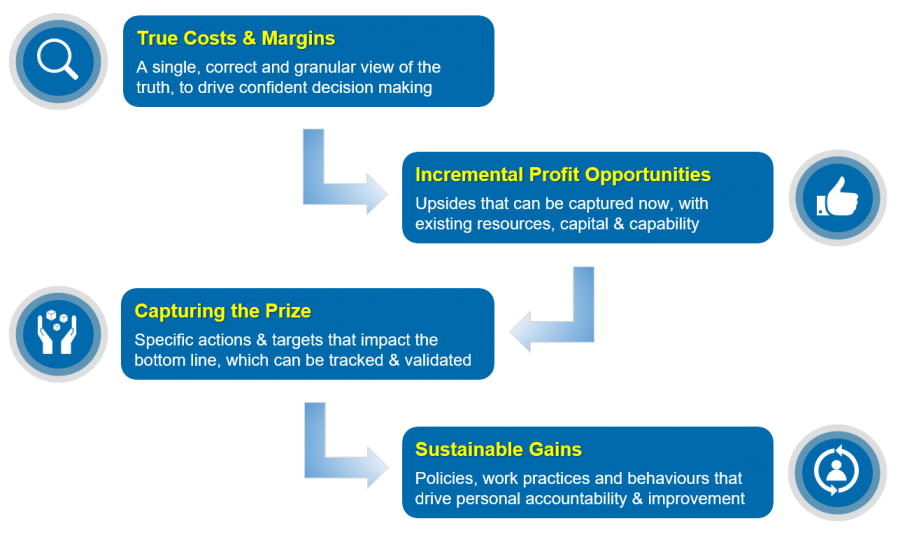
PCM invests time upfront to fully understand our clients’ business – not only operationally, but also from a cultural and capability perspective. Only then can we apply our methodologies and analytical tools with confidence, to identify and validate profit upsides.

Profit from our Perspective
PCM apply a proven approach that rapidly identifies, validates, captures and retains EBIT uplift.
Our cross industry experience, sophisticated analytics and performance benchmarks deliver granular insights and tangible upsides for immediate implementation.
Core Services
Cost To Serve
To fully understand the true profitability of individual customers, products and services, Cost to Serve analysis is applied, which aligns granular cost data to actual business operations, at transactional level.
PCM goes beyond traditional activity based costing methodologies and defines how and when costs are incurred for individual transactions, processes and product movements. This effectively builds up costs as they incurred, by leveraging existing business data, process mapping and powerful cost allocation models.
“The result is full cost transparency, consistent with actual business operations, to a transaction line item level of detail.”
This provides insights that highlight the true profit contribution of customers, products and services based – as opposed to average costing.
PCM then applies this information to identify and analyse variations specific costs, which in turn may highlight profit leakage points for specific customers or transaction types.
Examples of Cost to Serve Analysis
- Multi-handling of products within the distribution chain, including freight and warehousing
- Excessive sales and marketing support for unprofitable customers
- Inconsistent support for higher margin products and services. Under recovery of freight for customer deliveries, particularly for urgent small deliveries.
- Excessive order frequency and/or small order size, resulting in very high costs as a proportion of invoice value.
- Additional (working capital) costs associated with holding finished goods, debtors and payment methods.
- Costs associated with stock returns, warranty and product quality


Pricing Optimisation
PCM combines best practice experience and sophisticated diagnostics to help optimise pricing of products and services, taking into account market dynamics.
Custom built models are developed and deployed, as part of a formal PCM engagement, to define target pricing by customer, product and service, in a form that leverages existing ERP systems and is consistent with existing pricing structures.
Based on our experience in developing and implementing successful Pricing Programs, we believe the following considerations must be taken into account, prior to implementation :
- Pricing / discount tiers that reflect customer commitment in terms of volume, margin, cost to serve, share of wallet, growth potential, etc. that are objectively assessed.
- Target pricing based which can be applied at can be applied in several levels of granularity, to maximise margins.
- Customers in end-use markets with similar pricing structure and relative consistency.
- Existing customer price structures that do not match target pricing – and required subtle changes over time.
- The profit upside derived from Pricing Optimisation, based on pricing policy consistency and discipline. These include defined pricing structures, delegation of authority and migration plans (to target pricing), which are understood and supported by the field sales team.
- Variations (profit leakage) from the defined pricing matrix for individual customers, products and services, which drive field sales team priorities.
Dashboard Reporting
Making sense of disparate and inconsistent data from multiple sources, is one of the greatest challenges for business today.
PCM Dashboard Reporting transforms relevant business data into clear, concise and professional reporting – that delivers powerful insights and drive better decision making.
We achieve this by working collaboratively with clients to understand specific reporting requirements that best leverage available data and PCM’s profitability analysis, to drive required behaviours.
“PCM Dashboard Reporting offers far more than standard management reporting.”
They ultimately improve decision making, competitiveness and business profitability throughout your entire organisation, with a genuine focus on transparency and bottom line performance.
PCM Dashboards Deliver:
- A clear view of business profit drivers at all levels within the organisation, supported by flexible and interactive reporting.
- Genuine insight of profit contributions by customer, market segment, sales person, product and/or service.
- Mobile deployment to smartphones and tablets on a secure network.
- A single view of the truth that reconciles with financial statements and other standard reporting, which is not system platform dependent.
- Drill down functions, forecasting and analytics for a fraction of the investment that large BI providers charge.


Sales Force Effectiveness
Successful Sales Force Effectiveness (SFE) programs focus on generating more profit from existing customers, and retaining them in the long term – rather than constantly seeking new customers to fill a leaking bucket.
PCM works closely with Sales Teams to identify low profit or loss making customers, and move them up the profitability curve – by making many small, incremental improvements to sales, margins and servicing costs. When supported by the granular information insights available from Cost to Serve dashboard, Sales Teams are able to identify and prioritise specific upside opportunities by customer.
Dedicated workshops, Upside Tracking Tools (UTT) and ongoing support all ensure that the Sales Team are equipped with the direction and accountability required to deliver significant profit upsides.
PCM SFE programs are characterised by :
- Profit upsides, grouped into specific cost and margin driver categories are derived from rigorous analysis of Cost to Serve outputs.
- Specific upside opportunities are validated with the business prior, for the Sales Team to act on immediately.
- The Sales Team are fully engaged, early on. That is, they not only understand Cost to Serve and the opportunities arising from it, but genuinely believe in them and are equipped to capture them.
- Defined SFE incremental profit targets are set for individual Reps, prior to program roll out, which are monitored and managed by a centralised PMO function.
- The size of the (incremental profit) prize is based on many small upsides, captured frequently, from everyone in the Sales Team. In other words, SFE program success is driven by many small incremental gains, over a sustained period of time, across the entire business – rather than one giant leap.
- Every customer interaction is considered an opportunity to improve sales volume, product mix, margins and/or service efficiencies.
Benefits Realisation
PCM goes beyond traditional upside analysis and implementation frameworks – we are different. We actively work with our clients, in partnership, by embedding ourselves in the business, to validate, capture and retain the price in incremental steps identified and retain these games in the long term.
“Remember, opportunities alone are worth nothing, unless they are captured”
PCM’s success is dependent on our client’s success, measured as bottom line EBIT impact. We design and deploy Benefits Realisation Programs that capture profit upsides quickly, with minimal disruption to the business.
Many business improvement programs fail because they lack the planning and implementation expertise required. PCM has both, we align our Benefits Realisation with out client’s culture and capabilities, then actively engage the business as part of the rollout.
PCM Implementation Programs are characterised by:
- A framework that breaks down large opportunities into small, granular upsides, for individual customers, products and services
- Monitoring tools that measure upsides captured, drive personal accountability and highlight successful practices
- Updated business intelligence to track the progress of existing initiatives and identify new ones
- Interactive workshops and review sessions with sales teams and branch managers, to empower
- Ongoing mentoring, coaching and support, which continues to drive a culture of continuous improvement and accountability within the organisation.


Predictive Analytics
PCM has combined key attributes of predictive analytics with its customer profitability and pricing optimisation programs, with great effect.
The granular customer and product profitability view that PCM uses to identify upside opportunities can also be combined with known behavioural attributes and qualitative metrics to create powerful hypothesis testing models. Such models can be developed with a very high level of confidence and used to predict the outcomes policy or tactical market initiatives.
PCM’s predictive analytic tools can also be used to roll out agreed policies, pricing initiatives or changes to service offers in far more granular detail that broad brush initiatives.
PCM has successfully applied predictive analytics in its Cost to Serve and Benefits Realisation programs, to reinforce profit upsides that have been captured, and identify new opportunities.
Specific examples include :
- Predicting the early signs of customer churn and/or pressure on margins, which enable a business to proactive engage with at risk customers before they leave.
- Pricing changes at an individual customer level, based on sentiment and derived probabilities of acceptance / resistance, instead of general across the board price increases.
- Likely impact of proactive sales initiatives and potential competitor responses to protect key customers and/or market share.
- Predicted sales impact of changes to customer service offers, such a delivery frequency, minimum order value, freight recoveries, etc.
Performance Benchmarking
Performance Benchmarking is often the first step in defining, measuring and assessing the core drivers of business profitability.
Traditional Performance Benchmarking relies on manual data collection and at best, delivers a static comparison once or twice a year. Not only is this practice inefficient and outdated, but it also lacks currency and is susceptible to a ‘rubbish in – rubbish out’ outcome.
“PCM takes a different approach.”
PCM combines over two decades of Performance Benchmarking expertise with sophisticated analytics and cutting edge reporting platforms to deliver best in class Performance Benchmarking that drives stronger profit performance.
We bring information to life, with dynamic and interactive reporting that can be viewed on demand, anytime, anywhere. For distribution networks, PCM’s Performance Benchmarking delivers critical business intelligence.
Typical benefits of a PCM Performance Benchmarking Program:
- Customised reporting for business units identify specific profit upside opportunities.
- Critical analysis and comparison of business profit drivers, with supporting commentary and recommendations.
- On-demand availability and updates on a range of mobile devices including smartphones and tablets.
- Consolidation of best business practices, supported by a range of collaborative tools.


